
Neural Network Visualization using Guided Backprop
Date:
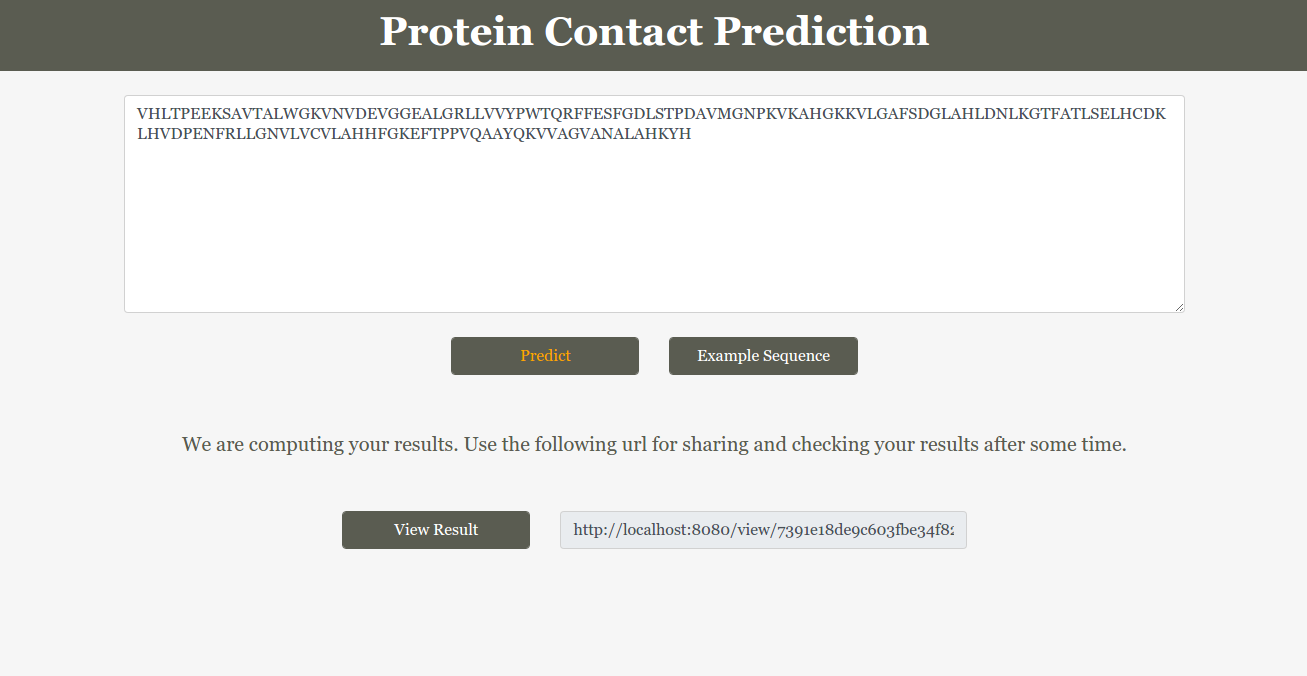
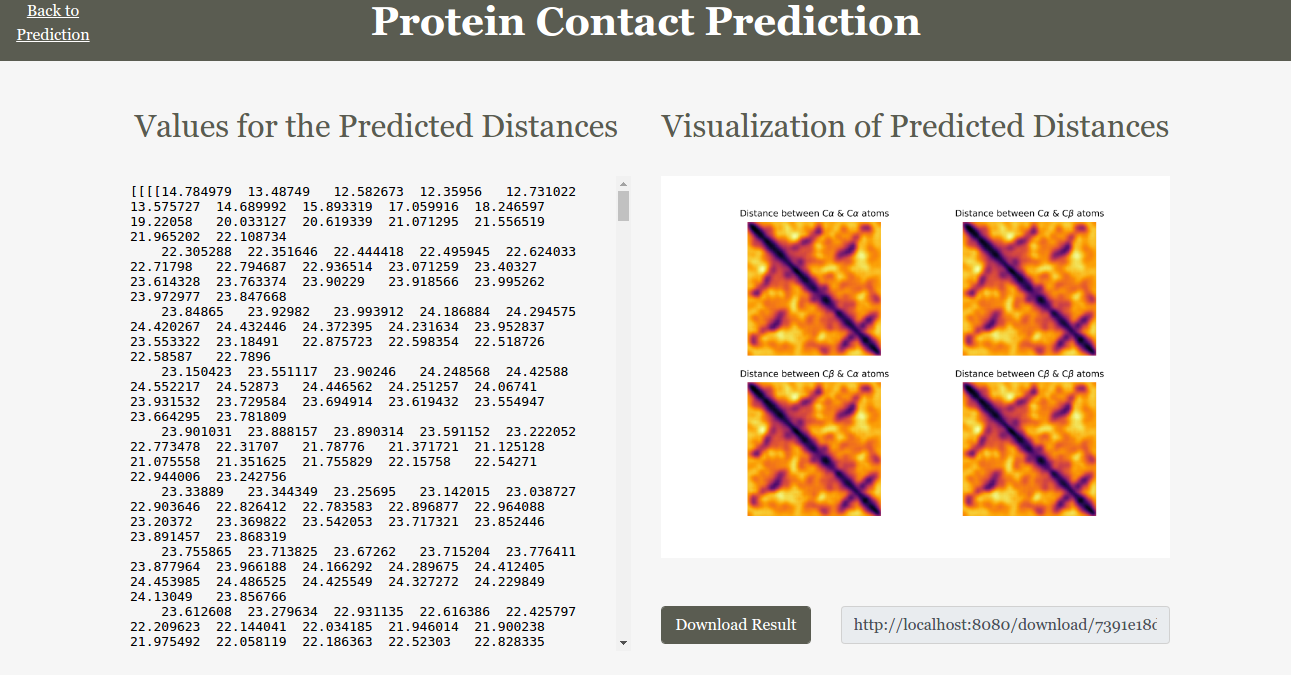
In this project we implemented a web interface for visualizing the working of a protein structure predicting Deep Neural Network using guided backpropagation technique. The goal of this technique is to visualize parts of the input that most activates a given neuron. An effective way of doing this is to visualize gradients of activations(output) with respect to the input.
These are some of the screen shots of the web interface we implemented.
There are a couple of methods like backward deconvnets and guided backpropagation that uses this idea of gradient visualization in order to better understand how the neural network works. The only difference in these methods is the way they handle the backpropagation of gradients through ReLU activations. According to the paper STRIVING FOR SIMPLICITY: THE ALL CONVOLUTIONAL NET the ’deconvolution’ is equivalent to a backward pass through the network, except that when propagating through a nonlinearity, its gradient is solely computed based on the top gradient signal, ignoring the bottom input. In case of the ReLU nonlinearity this amounts to setting to zero certain entries based on the top gradient. Guided backpropagation combines these two methods: rather than masking out values corresponding to negative entries of the top gradient (’deconvnet’) or bottom data (backpropagation), they mask out the values for which at least one of these values is negative. Intutively, it adds an additional guidance signal from the higher layers to usual backpropagation. This prevents backward flow of negative gradients, corresponding to the neurons which decrease the activation of the higher layer unit we aim to visualize.
This is one of the slides from our presentation that explains the difference between various approaches.
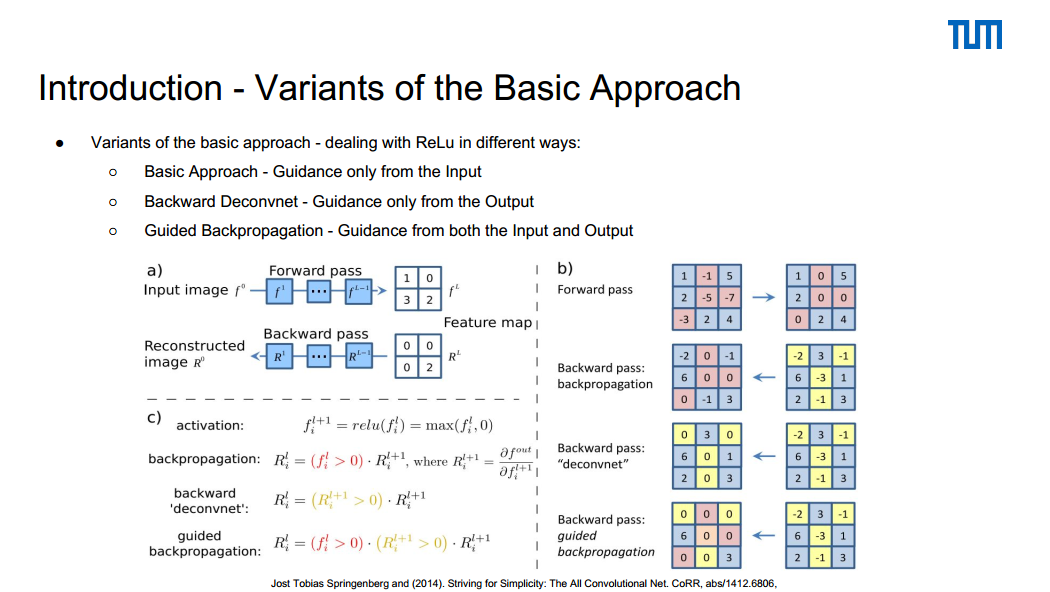
For more details read these slides
Source Code - Please email if you need access to the repository.